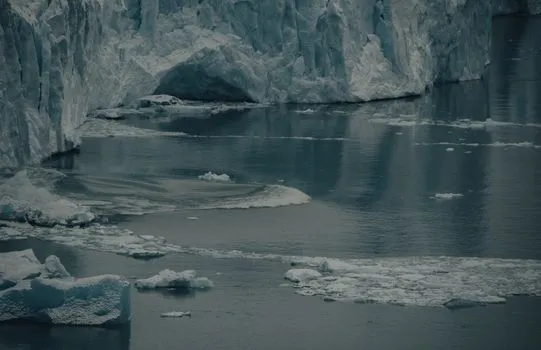
The Ice
Antarctic Ice Loss Acceleration
| Period | Mass Loss |
|---|---|
| 1980s | 48 ± 13 Gt/year |
| 1990s | 63 ± 24 Gt/year |
| 2000s | 139 ± 23 Gt/year |
| 2010s | 202 ± 22 Gt/year |
Cryosphere Key Data
| System | Metric | Value |
|---|---|---|
| Arctic sea ice | Lowest years in record | All 19 lowest since 2007 |
| Arctic sea ice | Ice-free summer | As early as 2027 |
| Greenland | Annual mass loss | 266 billion tonnes/year |
| Greenland | Consecutive loss years | 27 (since 1998) |
| Glaciers | Total lost since 1975 | 9 trillion tonnes |
| Glaciers | Lost in 2024 alone | 450 gigatonnes |
| Glaciers | Last decade share | 41% of all loss since 1976 |
| Permafrost | Carbon stored | 1,500 Gt (2× atmosphere) |
| Sea level | 2024 rise | 5.9 mm |
| Sea level | 2100 projection | 0.4–2.0 metres |
Glacier Loss by Region
- Himalayas: lost ~40% of ice mass since the Little Ice Age
- Alps: lost 50% since 1950, down to 1.2 m average ice thickness in 2024
- Peru: 50%+ surface area lost in 60 years, 175 glaciers disappeared between 2016 and 2020
The Albedo Feedback
Ice reflects 50–80% of incoming solar radiation. Dark ocean water absorbs ~90%. As ice retreats, the Arctic warms 4× faster than the global average. Between 1992 and 2018, ice loss alone had a warming impact equivalent to 10% of all greenhouse gases emitted in that period.
Tipping Points Already Crossed
At 1.5°C of warming, multiple Earth-system tipping points are considered already crossed or committed:
- Greenland ice sheet — irreversible decline
- West Antarctic ice sheet — marine ice-sheet instability triggered
- Tropical coral reefs — mass die-off underway
- Boreal permafrost — thaw releasing stored carbon
Sources
- NSIDC — 2025 Arctic Sea Ice Minimum
- NOAA Arctic Report Card 2025
- NASA — Antarctic Ice Mass Loss
- Science — Antarctica in 2025
- NASA — Greenland Ice Mass Loss
- Nature — First Ice-Free Arctic Before 2030
- NOAA — Global Sea Level
- Nature — Overshooting Greenland Threshold
- Global Tipping Points Report 2023
- The Arctic Institute — Permafrost Emissions