Planet-Scale Geospatial.
In Your Browser.
For Free.
Google Earth Engine brings petabytes of satellite data and cloud compute together so anyone can analyse the Earth from above
Google Earth Engine is one of the most important scientific computing platforms built for looking at the planet from above. It lets researchers, conservation teams, governments, NGOs, and developers analyse satellite imagery and other geospatial datasets without first downloading terabytes of files.
The short version is this:
Earth Engine brings the data and the computation together
. Instead of downloading satellite images onto your laptop and trying to process them locally, you write a script that tells Earth Engine what data you need, what filters to apply, what calculation to run, and what output you want. Google’s servers do the heavy lifting, then return a map, chart, table, image export, or application.
This guide explains what Earth Engine is, what people mean by its “model,” why it matters for science, and how to start using it. It is written for readers who understand basic science or conservation work but may be new to remote sensing and cloud geospatial computing.
Source note: This article was prepared using Google Earth Engine’s official website, Google for Developers documentation, Google Cloud Earth Engine pages, the Earth Engine Data Catalog, Google Research’s publication page for Gorelick et al. 2017, Dynamic World documentation, Hansen Global Forest Change documentation, and selected peer-reviewed references accessed on 14 June 2026.
What Is Google Earth Engine?
Google Earth Engine is a cloud-based geospatial processing service. Google describes it as a platform that combines a multi-petabyte catalog of satellite imagery and geospatial datasets with planetary-scale analysis capabilities, used to detect changes, map trends, and quantify differences on Earth’s surface.
In practice, Earth Engine gives you three things in one place:
| Part | What it means | Why it matters |
|---|---|---|
| Data catalog | A large public archive of satellite imagery and geospatial datasets, including Landsat, Sentinel, MODIS, climate, terrain, water, land cover, forest, fire, and population products. | You can start analysis without sourcing, downloading, cleaning, and storing raw imagery yourself. |
| Compute platform | Earth Engine runs geospatial operations on Google infrastructure. | You can process large areas and long time periods that would be difficult on a normal laptop. |
| Developer tools | A web Code Editor, JavaScript API, Python API, REST API, apps framework, exports, and links to Google Cloud services. | You can prototype, analyse, automate, publish apps, and connect results into bigger systems. |
The classic peer-reviewed paper is
Google Earth Engine: Planetary-scale geospatial analysis for everyone
by Gorelick, Hancher, Dixon, Ilyushchenko, Thau, and Moore. Google Research summarises the platform as a cloud-based system for planetary-scale geospatial analysis applied to deforestation, drought, disaster, disease, food security, water management, climate monitoring, and environmental protection.
Official sources:
Earth Engine homepage
,
Google for Developers Earth Engine docs
,
Google Cloud Earth Engine overview
, and
Google Research publication page
.
What Is “the Model”?
Google Earth Engine is not one AI model. It is better understood as a platform with several “models” working together: a data model, a programming model, a computation model, and optional machine-learning models.
| Model | Meaning in Earth Engine | Example |
|---|---|---|
| Data model | Earth observation data are represented as server-side objects such as images, image collections, features, feature collections, geometries, reducers, and dictionaries. | A Landsat scene is an |
| Programming model | You write JavaScript or Python code that builds an analysis recipe rather than directly processing every pixel on your own machine. |
|
| Computation model | Earth Engine uses server-side, deferred execution. Your script describes what should happen; Earth Engine decides how and when to compute the result. | A chain of operations may only run when you add a layer to the map, print a result, request a chart, or start an export task. |
| Science model | Researchers encode scientific assumptions into workflows: vegetation index thresholds, cloud masks, classification models, training data, change-detection rules, or uncertainty thresholds. | Using NDVI to estimate vegetation greenness or using Dynamic World class probabilities to estimate land-cover change. |
| Machine-learning model | Earth Engine includes built-in classifiers and can connect to
custom models hosted on Vertex AI through | Random Forest land-cover classification in Earth Engine, or a hosted deep-learning model that returns predictions as Earth Engine images. |
This distinction matters because people often say “the model says forest was lost” or “the model detected crops.” In Earth Engine, the platform may be executing a workflow, while the actual scientific model could be a threshold, a Random Forest classifier, a published dataset such as Dynamic World, or a deep-learning model hosted elsewhere.
Real Image References
These are real image links from official Google Earth Engine / Google for Developers pages that can be used as article visuals. They are included here as live image links rather than placeholders.
What Earth Engine Means for Science
Earth Engine changed environmental science because it lowered the barrier between a scientific question and a continental or global-scale answer. Before platforms like Earth Engine, a researcher often needed to discover satellite scenes, download them, store them, pre-process them, mosaic them, mask clouds, tile large rasters, run local software, and manage storage. That work still matters, but Earth Engine collapses much of the data-management burden into a shared cloud platform.
1. It makes planetary-scale analysis more accessible
A student, small conservation NGO, or researcher without a supercomputer can still ask large questions: how vegetation changed over a decade, where forest loss accelerated, how surface water shifted after drought, or where urban expansion is replacing natural habitat. The 2017 Earth Engine paper explicitly framed the platform as a way to empower not only remote-sensing specialists but also a broader audience lacking traditional supercomputing capacity.
2. It improves reproducibility
Earth Engine scripts can describe the dataset ID, date range, spatial filter, cloud mask, index calculation, reducer, visualization, and export process in one place. That makes it easier to rerun the same workflow for another year, region, or field site. It does not guarantee good science, but it gives teams a clear computational recipe.
3. It changes the scale of field science
Field surveys remain essential. Satellite data cannot tell you everything that is happening on the ground. But Earth Engine can help field teams decide where to sample, identify areas of rapid change, compare local observations to broader patterns, and generate spatial context for patrols, restoration planning, fire history, grazing pressure, water availability, habitat connectivity, and land-cover change.
4. It supports rapid environmental response
Because many datasets are updated regularly, Earth Engine can support post-fire analysis, flood mapping, drought monitoring, crop-condition mapping, storm damage mapping, and near-real-time land-cover monitoring when appropriate datasets are available. The speed advantage comes from having both current data and compute resources close together.
5. It encourages shared applications, not only papers
Earth Engine Apps allow researchers to publish interactive interfaces for non-technical users. This is important for science communication: a result can become a usable tool for land managers, park staff, policymakers, teachers, or community partners.
The Data Catalog: What You Can Analyse
The Earth Engine Data Catalog is the platform’s scientific foundation. Google Cloud describes the catalog as containing more than 90 petabytes of analysis-ready geospatial data and more than 1,000 curated geospatial datasets. Common datasets include satellite imagery, climate data, environmental indices, terrain, land cover, forest, water, fire, population, and administrative data.
| Dataset family | Common use | Example Earth Engine ID |
|---|---|---|
| Landsat | Long-term change since the 1980s; forest loss; water change; fire scars; vegetation trends. | LANDSAT/LC08/C02/T1_L2 |
| Sentinel-2 | Higher-resolution optical monitoring for vegetation, land cover, agriculture, wetlands, restoration, and habitat condition. | COPERNICUS/S2_SR_HARMONIZED |
| MODIS | Frequent global observations for vegetation, land surface temperature, fire, snow, and phenology. | MODIS/061/MOD13Q1 |
| Dynamic World | Near-real-time 10 m land-cover probabilities for nine classes derived from Sentinel-2. | GOOGLE/DYNAMICWORLD/V1 |
| Hansen Global Forest Change | Global forest extent and forest loss/gain time-series analysis from Landsat. | UMD/hansen/global_forest_change_2025_v1_13 |
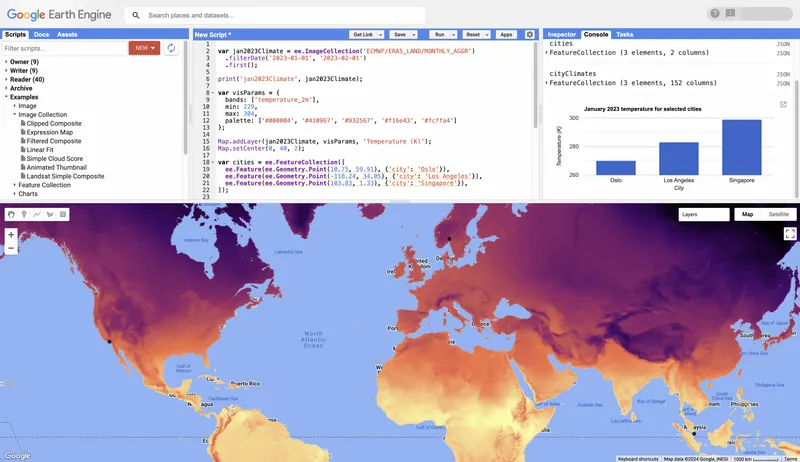
| Climate and weather reanalysis | Temperature, rainfall, evapotranspiration, drought, and climate context. | ECMWF/ERA5_LAND/MONTHLY_AGGR |
The important habit is to read each dataset’s catalog page before using it. Check the date range, spatial resolution, bands, units, scale factors, masks, update frequency, licensing, and citations. Satellite products are not interchangeable; a Landsat surface reflectance product, a Sentinel-2 top-of-atmosphere product, and a derived land-cover product answer different questions.
Core Concepts You Need to Know
| Concept | Plain meaning | Example |
|---|---|---|
| Raster | Grid of pixels. Each pixel stores values such as reflectance, temperature, NDVI, elevation, or probability. | Satellite image, elevation model, rainfall grid. |
| Vector | Points, lines, or polygons with attributes. | Camera-trap points, reserve boundary, river line, transect path. |
| Band | One layer inside an image. | Red, green, blue, NIR, SWIR, NDVI, land-cover probability. |
| ImageCollection | A group or time series of images. | All Sentinel-2 images over a park between January and March. |
| Filter | Select only the data you need. | Filter by date, location, cloud percentage, or metadata. |
| Map | Apply the same function to each item in a collection. | Calculate NDVI for every image in a time series. |
| Reduce | Summarise many values into fewer values. | Median image, mean NDVI per reserve, yearly forest-loss area. |
| Mask | Exclude pixels from analysis. | Remove clouds, shadows, no-data areas, or low-confidence classifications. |
| Export | Save results out of Earth Engine. | Export a GeoTIFF to Drive or a CSV table to Cloud Storage. |
How to Use Google Earth Engine
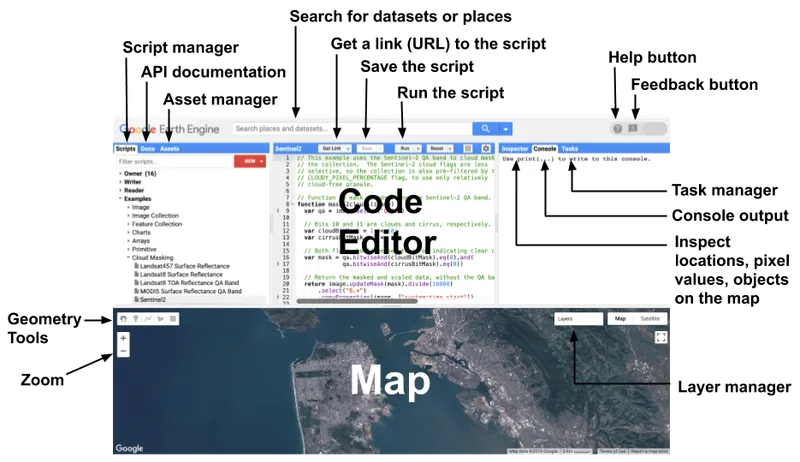
There are several ways to interact with Earth Engine. The best place to start is usually the browser-based Code Editor because it gives you immediate feedback: write code, run it, see the map, inspect pixels, print outputs, and start export tasks.
Step 1: Get access
Create or register a Google Cloud project for Earth Engine access. Google’s current access documentation requires projects to state whether their purpose is commercial or noncommercial. Academic, nonprofit, and some government users can use Earth Engine for noncommercial work, while operational commercial use requires paid commercial configuration. Google also introduced noncommercial eligibility verification and quota tiers, so users should check the current access page before starting a new project.
Start here:
Earth Engine access
and
JavaScript Code Editor quickstart
.
Step 2: Open the Code Editor
Open
code.earthengine.google.com
. The Code Editor contains the script editor, map, console, task manager, asset manager, dataset search, and drawing tools.
Step 3: Choose a question before choosing a dataset
Do not begin with “I want to use Sentinel-2.” Begin with a scientific question:
- Has vegetation cover changed around this waterhole?
Where has forest loss occurred inside a buffer around the reserve?
- Which restoration blocks have the strongest NDVI recovery?
- Did a flood alter surface water extent?
- Where did fire scars appear after the dry season?
Once the question is clear, choose data that match the required time period, resolution, geography, and uncertainty tolerance.
Step 4: Build a basic workflow
Most beginner Earth Engine workflows follow this pattern:
- Define a region of interest.
- Load an image or image collection.
- Filter by date and place.
- Mask clouds or poor-quality pixels.
- Create a composite or index.
- Display it on the map.
- Summarise values over a polygon.
- Export the result.
First Example: Sentinel-2 NDVI in the Code Editor
NDVI is a simple vegetation index based on near-infrared and red light. Healthy green vegetation usually reflects more near-infrared and absorbs more red light, so NDVI is often used as a first-pass measure of vegetation greenness. It is not a perfect measure of biodiversity, biomass, grazing pressure, or habitat quality, but it is useful for screening broad vegetation patterns.
Copy this into the Earth Engine Code Editor. Replace the point with your own reserve or study area.
// 1. Define a simple region of interest.
// Example point is in northeastern South Africa. Replace with your own site.
var roi = ee.Geometry.Point([31.5, -24.5]).buffer(10000);

// 2. Load Sentinel-2 surface reflectance imagery.
var s2 = ee
  .ImageCollection("COPERNICUS/S2_SR_HARMONIZED")
  .filterBounds(roi)
  .filterDate("2025-01-01", "2025-12-31")
  .filter(ee.Filter.lt("CLOUDY_PIXEL_PERCENTAGE", 20));

// 3. Create a median composite.
var composite = s2.median().clip(roi);

// 4. Calculate NDVI = (NIR - Red) / (NIR + Red).
// Sentinel-2: B8 is NIR, B4 is Red.
var ndvi = composite.normalizedDifference(["B8", "B4"]).rename("NDVI");

// 5. Display the result.
Map.centerObject(roi, 11);
Map.addLayer(roi, { color: "white" }, "Region of interest");
Map.addLayer(
  ndvi,
  {
    min: 0,
    max: 0.8,
    palette: ["brown", "yellow", "green"],
  },
  "NDVI 2025",
);

// 6. Summarise mean NDVI for the region.
var meanNdvi = ndvi.reduceRegion({
  reducer: ee.Reducer.mean(),
  geometry: roi,
  scale: 10,
  maxPixels: 1e9,
});

print("Mean NDVI", meanNdvi);
This workflow loads Sentinel-2 imagery, filters it to a year and region, makes a median composite, calculates NDVI, displays it, and prints a regional average. The same structure can be adapted to fire, water, urban growth, bare ground, crop monitoring, or habitat-screening questions.
Python Example: Using Earth Engine with Geemap
Python is useful when you want Earth Engine inside notebooks, data pipelines, dashboards, or reproducible research projects. The common beginner setup is the Earth Engine Python API plus geemap for interactive maps in notebooks.
import ee
import geemap

# Authenticate once, then initialize your Earth Engine project.
ee.Authenticate()
ee.Initialize(project="your-google-cloud-project-id")

# Define a region of interest.
roi = ee.Geometry.Point([31.5, -24.5]).buffer(10000)

# Load Sentinel-2 surface reflectance imagery.
s2 = (
    ee.ImageCollection("COPERNICUS/S2_SR_HARMONIZED")
    .filterBounds(roi)
    .filterDate("2025-01-01", "2025-12-31")
    .filter(ee.Filter.lt("CLOUDY_PIXEL_PERCENTAGE", 20))
)

# Median composite and NDVI.
composite = s2.median().clip(roi)
ndvi = composite.normalizedDifference(["B8", "B4"]).rename("NDVI")

# Display an interactive map.
Map = geemap.Map()
Map.centerObject(roi, 11)
Map.addLayer(ndvi, {"min": 0, "max": 0.8, "palette": ["brown", "yellow", "green"]}, "NDVI 2025")
Map
Python is a good choice when your Earth Engine output needs to be combined with pandas, GeoPandas, scikit-learn, xarray, local field data, camera-trap station tables, biodiversity observations, or reporting notebooks.
Example Science and Conservation Projects
| Question | Possible data | Earth Engine method | Important caution |
|---|---|---|---|
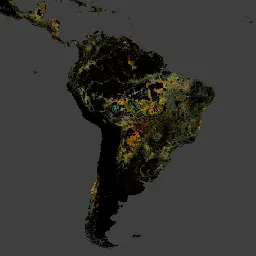
| Where has forest loss occurred? | Hansen Global Forest Change, Landsat | Mask forest loss pixels, summarise by reserve, watershed, or buffer. | Forest loss does not always equal illegal deforestation; validate context locally. |
| Is vegetation recovering after restoration? | Sentinel-2, Landsat NDVI/EVI | Build annual or seasonal composites and compare trends. | Greenness can increase because of invasive plants or rainfall, not necessarily ecological recovery. |
| Where did water availability change? | JRC Global Surface Water, Sentinel-2, Landsat NDWI | Map open water over time and compare seasonal periods. | Clouds, shadows, floating vegetation, and sediment can confuse water detection. |
| How is land cover changing near protected areas? | Dynamic World, Sentinel-2, national land-cover maps | Class probabilities, land-cover labels, change maps, buffer summaries. | Use probability thresholds and local validation; do not blindly trust class labels. |
| Where are fire scars visible? | MODIS fire products, Sentinel-2, Landsat NBR/dNBR | Use burn indices, active-fire products, and before/after composites. | Fire impact depends on season, fuel, intensity, and ecosystem type. |
| Can habitat suitability be mapped? | Remote sensing layers, elevation, water distance, vegetation indices, occurrence points | Export predictor layers or train a classifier/regression model. | Species observations are often biased toward roads, trails, and accessible places. |
Dynamic World: A Good Example of Earth Engine + AI
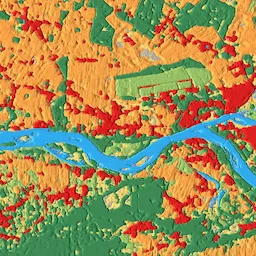
Dynamic World is a near-real-time, 10 m land use / land cover dataset created by Google and the World Resources Institute. It is available in Earth Engine as GOOGLE/DYNAMICWORLD/V1. The dataset provides probabilities and labels for nine classes: water, trees, grass, flooded vegetation, crops, shrub and scrub, built, bare, and snow/ice.
Dynamic World is useful because it shows how Earth Engine can host AI-derived environmental datasets. You do not have to train the deep-learning model yourself to use the output. But you still need to use it carefully: a class label is not the same as ecological truth, and the catalog recommends using probability thresholds when selecting pixels confidently belonging to a class.
// Dynamic World example: display most likely land-cover label.
var roi = ee.Geometry.Point([31.5, -24.5]).buffer(10000);

var dw = ee
  .ImageCollection("GOOGLE/DYNAMICWORLD/V1")
  .filterBounds(roi)
  .filterDate("2025-01-01", "2025-12-31");

var labelComposite = dw.select("label").mode().clip(roi);

var dwVis = {
  min: 0,
  max: 8,
  palette: [
    "#419BDF", // water
    "#397D49", // trees
    "#88B053", // grass
    "#7A87C6", // flooded vegetation
    "#E49635", // crops
    "#DFC35A", // shrub and scrub
    "#C4281B", // built
    "#A59B8F", // bare
    "#B39FE1", // snow and ice
  ],
};

Map.centerObject(roi, 11);
Map.addLayer(labelComposite, dwVis, "Dynamic World most common label");
Use Dynamic World for screening and monitoring, then validate important conclusions with field data, higher-resolution imagery, expert interpretation, or locally trained models.
Machine Learning in Earth Engine
Earth Engine supports several levels of machine learning:
Built-in supervised classifiers: Earth Engine’s classifier package includes algorithms such as CART, Random Forest, Naive Bayes, and SVM.
Unsupervised clustering: Useful for exploring spectral groups when labelled training data are limited.
Pre-made AI-derived datasets: Dynamic World is a strong example of a deep-learning-derived land-cover product hosted in Earth Engine.
Custom models through Vertex AI: Earth Engine can send image or table data to models hosted on Vertex AI using
ee.Model, then bring predictions back as images or tables.
For most conservation teams, the best starting point is not custom deep learning. Start with good data hygiene, clear labels, good reference data, and simple models. A carefully validated Random Forest classifier can be more useful than an impressive neural network trained on weak labels.
A simple supervised classification workflow
Choose classes: for example water, woodland, grassland, bare ground, cropland, built area.
Collect training polygons or points from field data or careful image interpretation.
Build predictor bands: Sentinel-2 bands, NDVI, NDWI, elevation, slope, texture, seasonality.
- Split training and validation data.
- Train a classifier.
- Classify the image.
- Calculate an error matrix and accuracy metrics.
- Inspect errors visually and revise training data.
Never publish a classification map without reporting what data trained it, how accuracy was assessed, what classes were confused, and where the model is likely to fail.
Exports, Assets, and Apps
Earth Engine analysis often ends in one of four ways:
| Output | Use it when | Example |
|---|---|---|
| Map layer | You want to inspect or demonstrate a result visually. | NDVI map, land-cover layer, forest-loss layer. |
| Chart | You want to show a time series or relationship. | Monthly NDVI trend for a reserve. |
| Table export | You need statistics in CSV, BigQuery, or another analysis tool. | Mean NDVI per restoration block per month. |
| Image export | You need a raster result for GIS, reports, modelling, or archiving. | GeoTIFF of classified land cover. |
| Earth Engine App | You want non-technical users to interact with your analysis. | Dashboard for fire history, water points, vegetation trend, or forest change. |
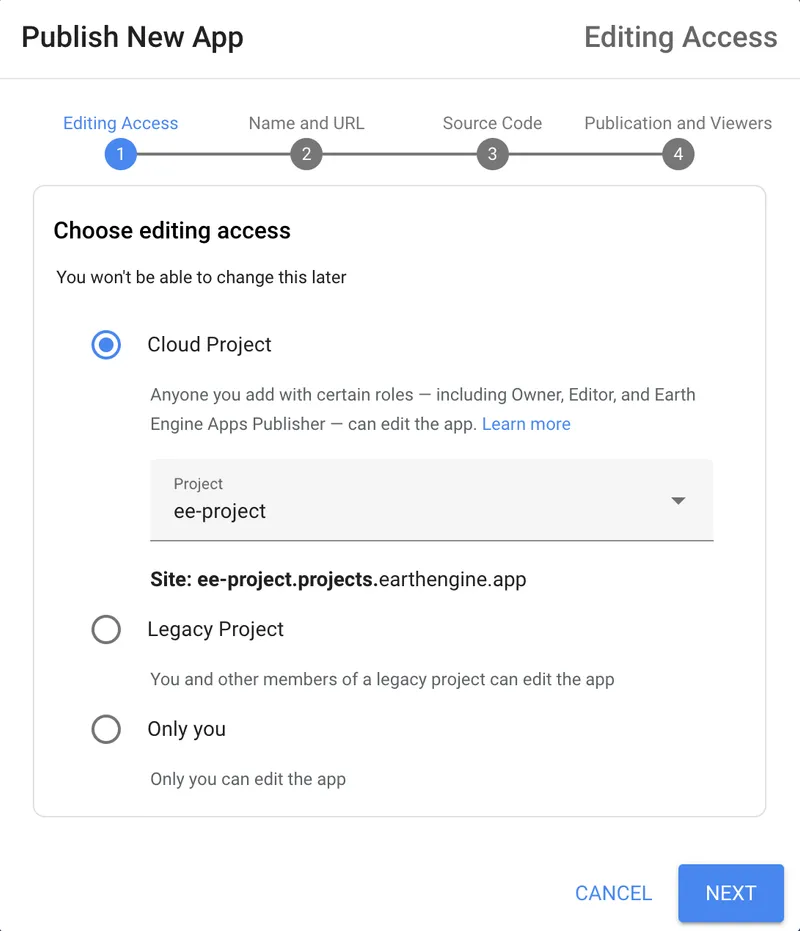
Earth Engine Apps can be public or access-controlled depending on how you configure them. For team science, project-owned apps are useful because collaboration can be managed through a Google Cloud project rather than one person’s account.
Good Scientific Practice
Earth Engine makes large-scale analysis easier, but it does not remove the need for scientific caution. The most common mistakes are not technical; they are conceptual.
Do not confuse pixels with proof
A satellite pixel is a measurement or model output. It is not the same as a direct field observation. For example, a red pixel in a forest-loss layer may represent a stand-replacement disturbance, but the cause could be logging, fire, storm damage, mining, plantation harvesting, or classification error.
Always match scale to the question
If your study area is a small wetland, a 500 m MODIS product may be too coarse. If your study period is 40 years, Sentinel-2 is too recent on its own. If your question is species habitat quality, a single NDVI value is usually not enough.
Record uncertainty
Good Earth Engine outputs should state the dataset version, date range, spatial resolution, masks used, thresholds used, model assumptions, and validation method. For AI-derived products, include confidence or probability thresholds where available.
Use local knowledge
Field rangers, ecologists, farmers, community members, reserve managers, and local researchers often understand land-use history that satellite data alone cannot explain. The best science usually combines remote sensing with local evidence.
Protect sensitive information
When mapping threatened species, nests, dens, rhino habitat, pangolin sightings, rare plants, archaeological sites, or anti-poaching infrastructure, do not publish exact coordinates without a clear data-sensitivity review.
Conservation Use Cases
Earth Engine is especially useful for conservation because it can connect field operations to landscape context. A conservation team can combine satellite-derived layers with camera-trap stations, ranger patrols, wildlife sightings, restoration plots, water points, fences, fire scars, community land-use zones, and protected-area boundaries.
| Use case | Earth Engine role | Field validation |
|---|---|---|
| Anti-poaching patrol planning | Map access routes, vegetation cover, burn scars, water availability, and recent disturbance. | Ranger intelligence, patrol tracks, incident reports. |
| Habitat monitoring | Track vegetation seasonality, woody cover, bare ground, water extent, and land-cover change. | Vegetation plots, ecological surveys, drone imagery. |
| Restoration monitoring | Compare before/after NDVI, canopy, wetness, bare ground, and fire history. | Species composition, survival counts, soil condition, invasive species checks. |
| Camera-trap site selection | Stratify sampling by habitat type, distance to water, slope, fire history, and land-cover class. | Ground scouting, access/safety checks, animal sign. |
| Wildlife corridor analysis | Map habitat continuity, settlement expansion, crop conversion, barriers, and riparian strips. | Movement data, spoor, telemetry, local knowledge. |
Limits and Risks
Earth Engine is powerful, but it has important limits.
It is not a substitute for fieldwork. Satellite data cannot identify every species, explain every cause, or replace local ecological knowledge.
Clouds and shadows matter. Optical satellite images can be badly affected by clouds, smoke, haze, or shadows.
Resolution matters. A 10 m pixel, 30 m pixel, and 500 m pixel can tell different stories.
Dataset versions change. Re-run analyses when data products update, and cite exact versions.
Quotas and exports can fail. Very large tasks may hit memory, time, scale, or quota limits.
Commercial/noncommercial rules matter. Check access, billing, verification, and terms before operational or paid work.
Privacy and sensitive-location risks are real. Apps and map layers can expose information if published carelessly.
A Practical Learning Path
A beginner does not need to master everything at once. A good learning sequence is:
Run the Code Editor quickstart. Learn
Map.addLayer(),print(), raster layers, vector points, and simple charts.Learn Image and ImageCollection. Understand bands, metadata, date filters, spatial filters, and composites.
Learn masking. Clouds, shadows, no-data pixels, and quality bands are often the difference between good and bad analysis.
Learn reducers. Reducers let you calculate summaries over time, space, polygons, and regions.
Learn exports. Practise exporting small results before attempting national-scale maps.
Use one real local project. Pick a reserve, wetland, restoration site, or catchment you know well.
Add validation. Compare outputs with field notes, GPS points, drone images, camera-trap locations, or expert interpretation.
Publish carefully. Build an app only after checking privacy, licensing, and sensitive-location risks.
Earth Engine Cheat Sheet
| Task | Common function | Example |
|---|---|---|
| Load one image | ee.Image() | ee.Image(‘UMD/hansen/global_forest_change_2025_v1_13’) |
| Load time series | ee.ImageCollection() | ee.ImageCollection(‘COPERNICUS/S2_SR_HARMONIZED’) |
| Filter by date | filterDate() | .filterDate(‘2025-01-01’, ‘2025-12-31’) |
| Filter by place | filterBounds() | .filterBounds(roi) |
| Calculate NDVI | normalizedDifference() | image.normalizedDifference([‘B8’, ‘B4’]) |
| Create a composite | median(), mean(), mosaic() | collection.median() |
| Summarise an area | reduceRegion() | image.reduceRegion({reducer: ee.Reducer.mean(), geometry: roi, scale: 10}) |
| Add a layer to map | Map.addLayer() | Map.addLayer(ndvi, vis, ‘NDVI’) |
| Export image | Export.image.toDrive() | Save a GeoTIFF for GIS. |
| Export table | Export.table.toDrive() | Save regional summaries as CSV. |
Example Export
Exports are handled as tasks. After running this code, open the Tasks tab in the Code Editor and click Run to start the export.
Export.image.toDrive({
  image: ndvi,
  description: "ndvi_2025_roi",
  folder: "earth_engine_exports",
  fileNamePrefix: "ndvi_2025_roi",
  region: roi,
  scale: 10,
  maxPixels: 1e9,
});
Keep exports small while learning. Once your workflow is correct, scale up gradually.
Before You Trust an Earth Engine Result
Use this checklist before reporting a result:
- Did I use the correct dataset version?
- Did I read the dataset documentation?
- Did I check band units and scale factors?
Did I mask clouds, shadows, no-data pixels, or low-quality observations?
- Did I choose a resolution that matches my question?
Did I compare the result against field evidence or high-resolution imagery?
- Did I record uncertainty and limitations?
- Did I cite the dataset and Earth Engine correctly?
Did I avoid publishing sensitive coordinates or protected species locations?
Sources and Further Reading
Google Earth Engine homepage
.
Google Earth Engine documentation
.
Google Cloud Earth Engine overview
.
Earth Engine Data Catalog
.
Earth Engine Code Editor guide
.
Get started with Earth Engine in the Code Editor
.
Earth Engine access documentation
.
Earth Engine pricing
.
Earth Engine noncommercial quota tiers
.
Gorelick et al. 2017 — Google Earth Engine: Planetary-scale geospatial analysis for everyone
.
Harmonized Sentinel-2 MSI Level-2A Surface Reflectance catalog page
.
Landsat collections in Earth Engine
.
Dynamic World V1 Data Catalog
.
Dynamic World about page
.
Brown et al. 2022 — Dynamic World, near real-time global 10 m land use land cover mapping
.
Hansen Global Forest Change v1.13 Data Catalog
.
Hansen et al. 2013 — High-resolution global maps of 21st-century forest cover change
.
Earth Engine supervised classification guide
.
Predictions from hosted models using Vertex AI and Earth Engine
.
Earth Engine Apps documentation
.